December 2025 & Year-End Statistics
BUSIEST YEAR ON RECORD
Hector International Airport’s airline passenger traffic in December showed a slight decrease when compared to the same month in 2024. In December 2025, the passenger enplanements were 49,861. This is a decrease of 1% when compared to the December 2024 passenger enplanements of 50,400.
The total passenger count for the month was 96,249, which is down 3% over the same period last year.
There were 626 air carrier departures with an average of 99 seats per flight in December and an average of 3,105 total daily passengers.
| Airline | City | Aircraft | Market Share | Enplanement Change from December 2024 |
|---|---|---|---|---|
| Delta | Minneapolis & Atlanta | B739, A320/321, E175 & CR9 | 31% | 1% |
| United | Chicago & Denver | A320/19, E175 & CRJ550/7/2 | 21% | 0% |
| Allegiant | Las Vegas, Nashville, Orlando, Phoenix & Tampa | B73M, A319/320 | 21% | -7% |
| American | Chicago, Dallas & Phoenix | E175 | 23% | -1% |
| Frontier | Denver | A320/21 | 3% | 10% |
| Passengers | Dec 2025 | Dec 2024 | % Change | YTD 2025 | YTD 2024 | % Change |
|---|---|---|---|---|---|---|
| Total | 96,249 | 98,882 | -3% | 1,179,442 | 1,092,836 | 8% |
| Enplaned | 49,861 | 50,400 | -1% | 590,542 | 546,787 | 8% |
| Deplaned | 46,388 | 48,482 | -4% | 588,900 | 546,049 | 8% |
Year-End 2025 Summary – Busiest Year on Record
Airline passenger traffic in 2025 at Hector International Airport showed an increase as compared to 2024. In 2025, the total passenger enplanements were 590,542. This is an increase of 8% when compared to the 2024 passenger enplanements of 546,787.
The total passenger count for the year was 1,179,442, which is up 8% over 2024 which had 1,092,836 total passengers.
Hector Airport had 7,573 air carrier landings in 2025 that averaged 94 seats per flight and averaged an 84% load factor.
| & Atlanta | City | Market Share | Change from 2024 | |
|---|---|---|---|---|
| Delta | Minneapolis & Atlanta | 30% | -1% | |
| United | Chicago & Denver | 24% | 3% | |
| Allegiant | Las Vegas, Nashville, Orlando*, Phoenix & Tampa* | 19% | 0% | |
| American | Chicago, Dallas & Phoenix* | 23% | 1% | |
| Frontier | Denver & Orlando* | 4% | -4% | |
| * denotes seasonal service | ||||
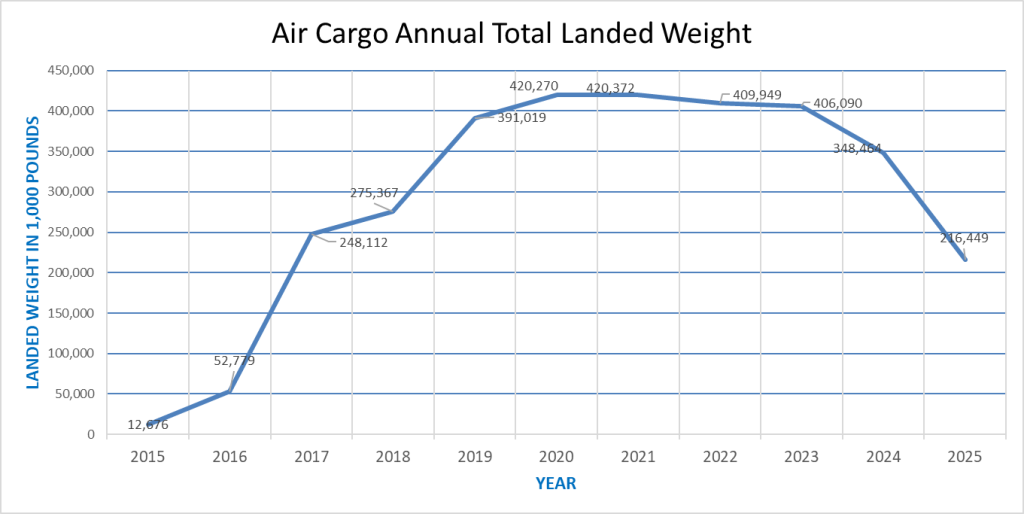
Air Cargo 2025 Summary
In 2025, 5,180 air cargo aircraft landed with a total landed weight of 215,061,892 pounds. This compares to 2024 of 5,518 air cargo aircraft landed with a total landed weight of 349,270,730 pounds. 2025 had a -38% decrease over the previous year. This decrease follows a national air cargo trend and also the cancellation of the USPS mail contract with FedEx.
Air Traffic 2025 Summary
Air traffic operations showed a slight decrease in 2025 over the previous year. In 2025, there were 80,370 total operations compared to 82,632 in 2024. This is a decrease of -2.7%.
Total annual air traffic operations equate to over 220 landings and departures every day.